Candlestick charts have become a popular tool for traders to analyze financial markets. This technique originated in Japan in the 18th century and was introduced to the Western world in the late 20th century. Candlestick charts are used to display price movements over a specific period of time, usually in the form of a day, week, or month.
A bullish regular candlestick is one of the most common and widely recognized patterns in candlestick charting. It is a bullish pattern that occurs when the closing price is higher than the opening price, indicating that buyers are in control of the market. The body of the candlestick is usually colored green or white, while the shadows (upper and lower wicks) are relatively small compared to the body.
Bullish regular candlesticks are an important tool for traders because they provide valuable information about the market sentiment. A bullish regular candlestick indicates that the buyers are in control of the market, and there is a high probability of a bullish trend. Traders who are bullish on the market may use this pattern as an indication to buy or hold their positions.
However, it is important to note that a bullish regular candlestick is not a guarantee of a bullish trend. Traders should always use other technical indicators and fundamental analysis to confirm the trend before making a trading decision.
Let's take a closer look at the components of a bullish regular candlestick and how to identify this pattern.
Components of a Bullish Regular Candlestick
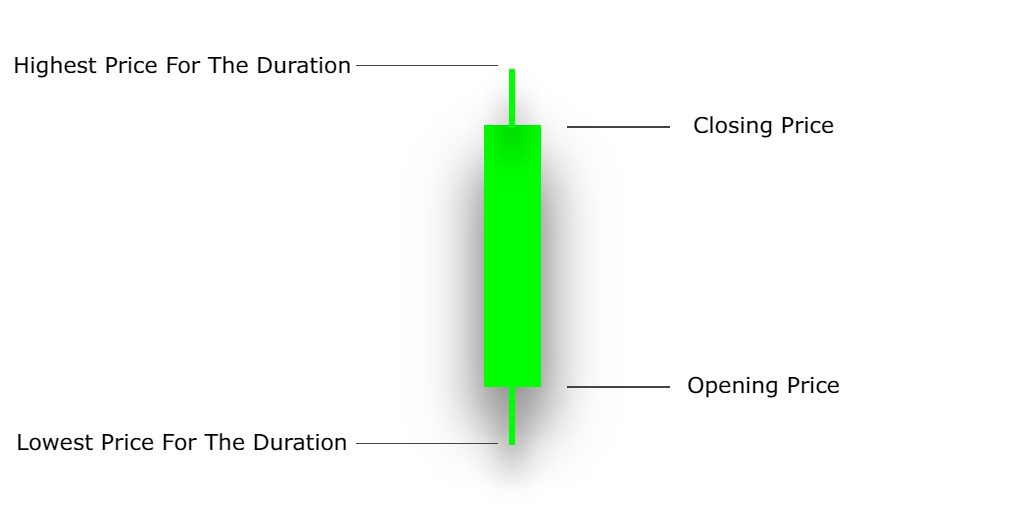
A bullish regular candlestick has three components: the body, the upper wick, and the lower wick.
1. The Body
The body of the candlestick represents the opening and closing prices of the market during the time period being analyzed. A bullish regular candlestick has a relatively long body, indicating a strong bullish sentiment in the market.
The color of the body can vary, but it is usually green or white. In some charting platforms, the bullish candlestick is filled with color to represent the difference between the opening and closing prices.
2. The Upper Wick
The upper wick represents the highest price that the market reached during the time period being analyzed. A bullish regular candlestick has a relatively small upper wick, indicating that the buyers are in control of the market and pushing the price up.
3. The Lower Wick
The lower wick represents the lowest price that the market reached during the time period being analyzed. A bullish regular candlestick has a relatively small lower wick, indicating that the buyers are in control of the market and pushing the price up.
How to Identify a Bullish Regular Candlestick
To identify a bullish regular candlestick, you need to look for the following characteristics:
1. The closing price of the candlestick must be higher than the opening price.
2. The body of the candlestick must be relatively long, indicating a strong bullish sentiment.
3. The shadows (upper and lower wicks) must be relatively small compared to the body.
Once you have identified a bullish regular candlestick, it is important to confirm the trend using other technical indicators and fundamental analysis before making a trading decision.
Conclusion
Bullish regular candlestick patterns can be a powerful tool for identifying potential bullish trends in the market. Traders who are new to candlestick charting should take the time to learn how to identify this pattern and use it in conjunction with other technical indicators and fundamental analysis to make informed trading decisions. With practice, traders can use bullish regular candlesticks to improve their trading strategies and achieve greater success in the financial markets.