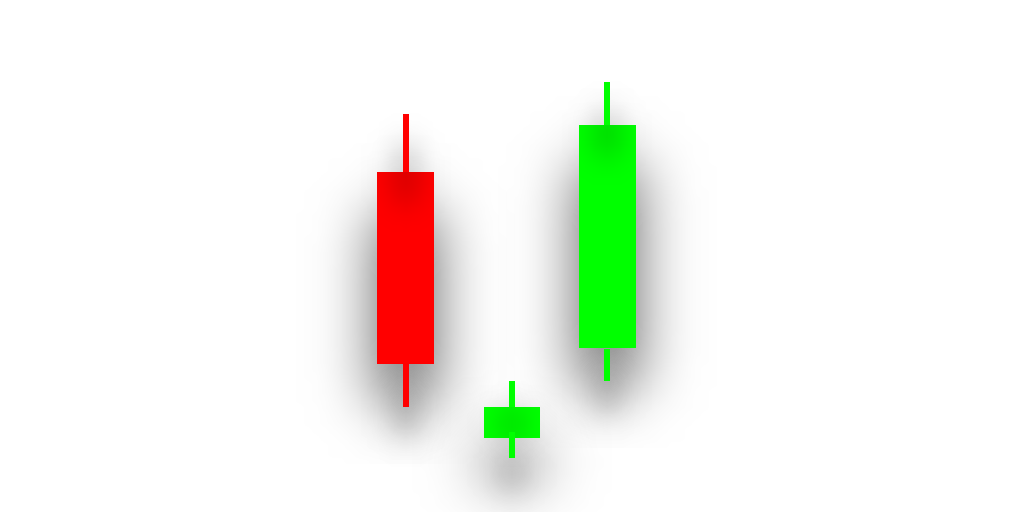
The morning star is a bullish reversal pattern that is commonly used in technical analysis to signal a potential reversal in a downtrend. The pattern consists of three candlesticks that suggest that the bears are losing control of the market, and that the bulls are starting to gain momentum.
The first candle in the pattern is a long bearish candlestick that reflects the existing downtrend. The second candle is a small-bodied candlestick that may be bullish or bearish and gaps down from the previous candle. This candle is called the "star" and represents a moment of indecision in the market. The third candle is a long bullish candlestick that closes above the midpoint of the first candle.
Beginner traders can use the morning star pattern to identify a potential reversal in a downtrend. When the pattern appears, it is a signal that the selling pressure is subsiding, and that buyers may be gaining control of the market. However, it is important to confirm the pattern with other technical analysis tools before making a trade.
To confirm the morning star pattern, traders can look for other bullish signals such as the Relative Strength Index (RSI) and Moving Average Convergence Divergence (MACD) indicators. The RSI measures the strength of a stock's price action, and a reading above 50 indicates bullish momentum. The MACD is a trend-following momentum indicator that can confirm a trend reversal when the MACD line crosses above the signal line.
Intermediate traders can use the morning star pattern in combination with other technical analysis tools to create a trading strategy. For example, traders can use the pattern to identify potential entry and exit points, as well as support and resistance levels. When the pattern appears near a support level, it can be a signal to buy the stock. Similarly, when the pattern appears near a resistance level, it can be a sign to sell the stock.
Advanced traders can use the morning star pattern as part of a comprehensive trading system. They can combine the pattern with other technical analysis tools, such as Fibonacci retracements, to identify potential price targets. By using the morning star pattern in conjunction with Fibonacci retracements, traders can identify potential price targets for a bullish trend continuation.
In conclusion, the morning star pattern is a reliable pattern used in technical analysis to signal a potential bullish trend reversal. It is a three-candlestick pattern that suggests that the bulls are gaining control of the market and that the bearish trend is likely to reverse. Beginner traders can use the pattern as a basic signal to identify a potential reversal, while intermediate and advanced traders can use it in combination with other technical analysis tools to create a trading strategy or a comprehensive trading system. However, it is important to confirm the pattern with other technical analysis tools and to practice risk management to minimize losses.