Bullish engulfing candlestick is one of the most popular patterns used in technical analysis. It is a bullish reversal pattern that occurs when a small bearish candlestick is followed by a larger bullish candlestick that completely engulfs the previous candlestick. The pattern is formed when the buyers overwhelm the sellers, and it signals a potential bullish trend reversal.
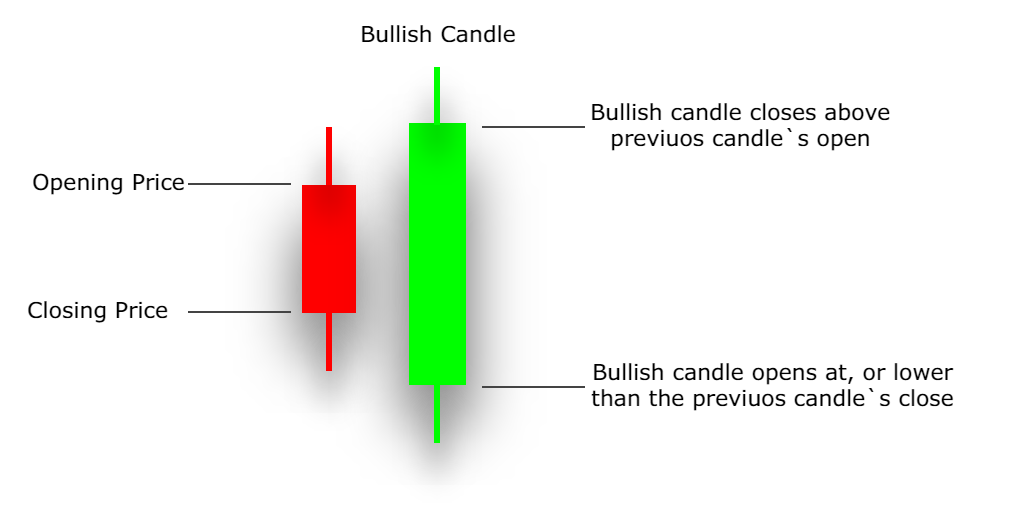
The bullish engulfing pattern is a two-candle pattern, and it is considered a strong signal when it appears after a downtrend. The bullish candlestick should open below the close of the previous candlestick and close above the high of the previous candlestick. The larger the bullish candlestick, the more significant the signal.
Beginner traders can use the bullish engulfing pattern as a basic signal to identify a potential reversal. When the pattern appears, it is a sign that buyers are gaining control over the market, and that a bullish trend may be forming. However, it is important to note that the bullish engulfing pattern is not always a reliable indicator of a trend reversal. It is essential to confirm the signal with other technical analysis tools.
To confirm the bullish engulfing pattern, traders can look for other bullish signals such as the Relative Strength Index (RSI) and Moving Average Convergence Divergence (MACD) indicators. The RSI measures the strength of a stock's price action, and a reading above 50 indicates bullish momentum. The MACD is a trend-following momentum indicator that can confirm a trend reversal when the MACD line crosses above the signal line.
Intermediate traders can use the bullish engulfing pattern in conjunction with other technical analysis tools to create a trading strategy. For example, traders can combine the bullish engulfing pattern with support and resistance levels to identify potential entry and exit points. When the pattern appears near a support level, it can be a signal to buy the stock. Similarly, when the pattern appears near a resistance level, it can be a sign to sell the stock.
Advanced traders can use the bullish engulfing pattern as part of a comprehensive trading system. They can combine the pattern with other technical analysis tools, such as Fibonacci retracements, to identify potential price targets. Fibonacci retracements are a popular tool used to identify potential support and resistance levels based on the Fibonacci sequence. By using the bullish engulfing pattern in conjunction with Fibonacci retracements, traders can identify potential price targets for a bullish trend reversal.
Moreover, it is important to keep in mind that the bullish engulfing pattern can also be found in other financial markets, such as forex and cryptocurrencies. It is essential to adjust the trading strategy according to the market being traded.
Additionally, traders should be aware of the limitations of the bullish engulfing pattern. While it is a reliable indicator, it is not foolproof, and there may be false signals. Therefore, it is important to use the pattern in conjunction with other technical analysis tools and to practice proper risk management to minimize losses.
Traders can also experiment with different timeframes to identify the best time to use the bullish engulfing pattern. Short-term traders may use the pattern on a daily or hourly chart, while long-term traders may use it on a weekly or monthly chart.
Finally, traders should also consider the overall market conditions when using the bullish engulfing pattern. It may not be an effective signal in a highly volatile or uncertain market. Traders should also consider the fundamental factors that may affect the market and adjust their trading strategy accordingly.
In conclusion, the bullish engulfing pattern is a popular and reliable pattern used in technical analysis. It is a two-candle pattern that signals a potential bullish trend reversal when it appears after a downtrend. Beginner traders can use the pattern as a basic signal to identify a potential reversal, while intermediate and advanced traders can use it in combination with other technical analysis tools to create a trading strategy or a comprehensive trading system. However, it is important to confirm the pattern with other technical analysis tools and to practice risk management to minimize losses.